

April 11, 2010
TRADE: Atmus Bear Call Spread
Ticker: ATMU
TRADE INSTRUCTIONS
Place the following roll trade for a DEBIT:
Buy to Open ATMU May 10 2024 $31 Put
Sell to Open ATMU May 10 2024 $27 Put
Aim for a DEBIT of between $0.5 and $0.8 per contract (you will pay between $50 and $80 per contract traded in option premium as income into your account).
The maximum amount we can earn from this trade is $400 per contract , while our maximum loss is capped at the price (debit amount) that we pay to establish the position.
Our maximum LOSS is the cost to establish the position, so between $50 and $80 per contract.
Thus, our maximum PROFIT is $350 – $320 per contract, or roughly 4X our capital at risk.
In our opinion, this is an outstanding risk-reward proposition, considering the strong tendency of spin-offs to sell off after their initial trading period.
Establishing a position anywhere in the range provided should yield solid profits if ATMU decreases by -6% or more by May 10th.
INVESTMENT THESIS RECAP
ATMU Current Price: $32.3
Stock Price Target: Below $31
Upside: +$320
Downside: -$80
This bearish trade, if 100% successful, would return a maximum of approximately 4X our cost to establish the position.
If unsuccessful, the maximum we can lose is ~$80/contract, if ATMU finishes above $31 on May 10, 2010, assuming that we have not closed out the position by then. We cannot lose more than the cost to us for establishing the position.
If we were massively bearish on ATMU, we could simply buy the May 10 $31 Put. The reason that we recommend using the Bear Put Spread is that we are trading a historical trend, not on a deep conviction that the stock is massively overpriced or destined for failure. The advantage of using a spread strategy is the much lower cost to establish the bearish position than simply buying puts. In turn, this reduces the price that we need ATMU to decline in order for the trade to be profitable.
The Bear Put Spread consists of a long Put combined with short put with the same expiration but at a lower strike price. The “spread” refers to the difference between the two strikes, and the maximum final value is equal to:
(Strike Price of the Long Put – Strike Price of the Short Put) x 100.
In our case, $32 – $27 = $4, so $400 ($4 x 100) is the maximum amount that we would receive per contract at expiration.

Source: OptionStrat.com
The drawback of using the Bear Put Spread strategy is that we are giving up the additional profits if ATMU declines below $27 by May 10th. Even so, the risk-reward profile using this strategy is more heavily in our favor, compared to the alternative of simply buying puts.
Our breakeven price for the ATMU is ~$30.2, which is ~6% below the current level that ATMU is trading today.
Here’s how the payoff picture of this trade appears, based on most current pricing data (subject to change, of course):
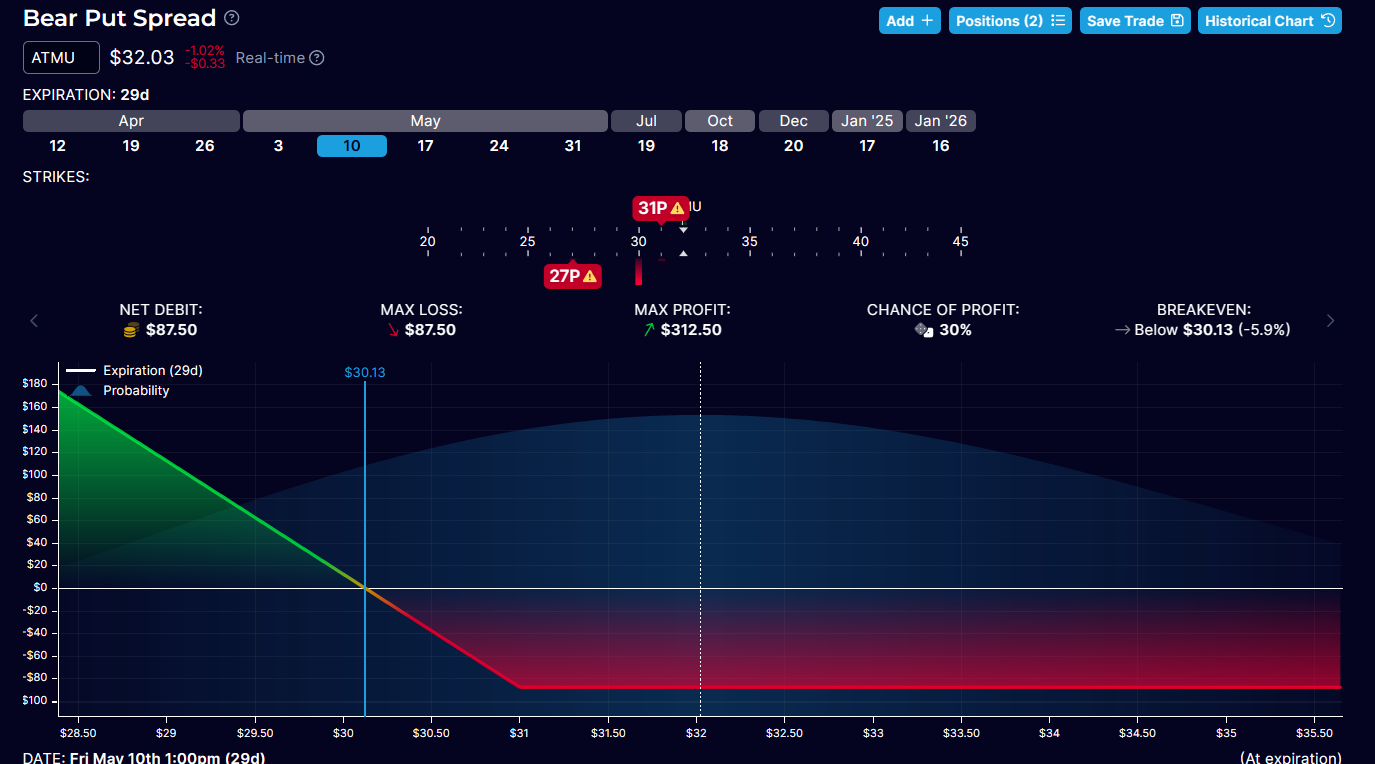
Source: OptionStrat.com
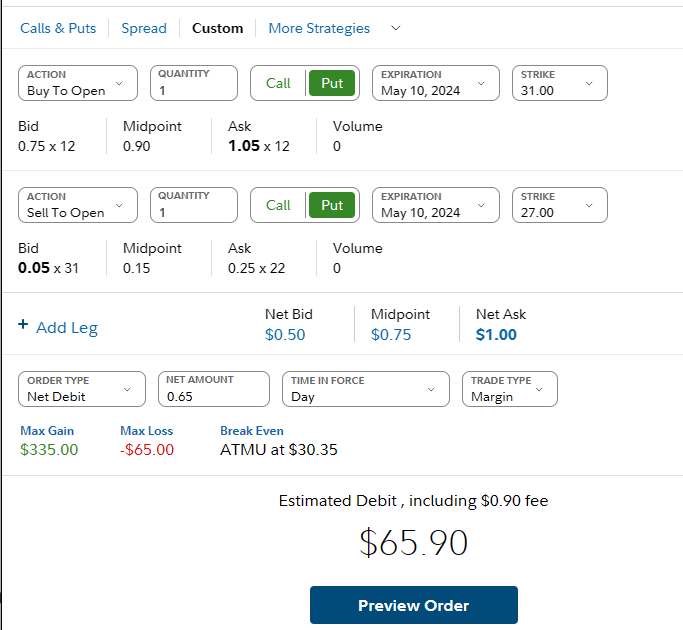
This is how the trade looks on Fidelity’s platform but should appear similar regardless of which brokerage you are using.
TRADE PROFILE
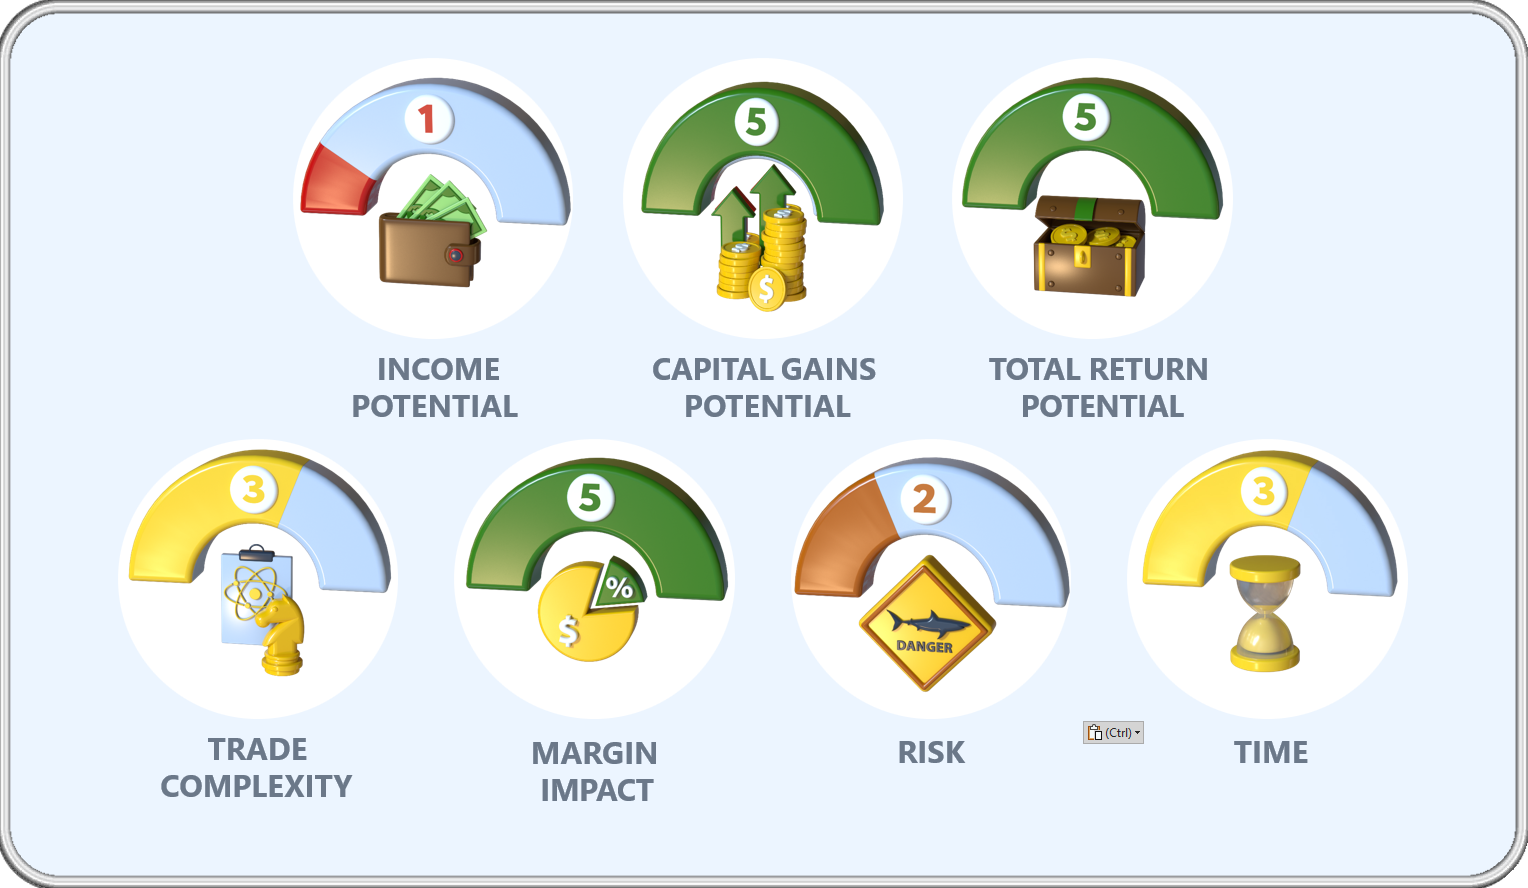
For a more in-depth discussion (or just a refresher) on each of these ratings, please visit the Trade Ratings Guide page here.
DETAILS
Historically, stocks that are split off from their parent via a share exchange (like ATMU) perform poorly over the first 40 days of trading.
See the data below.
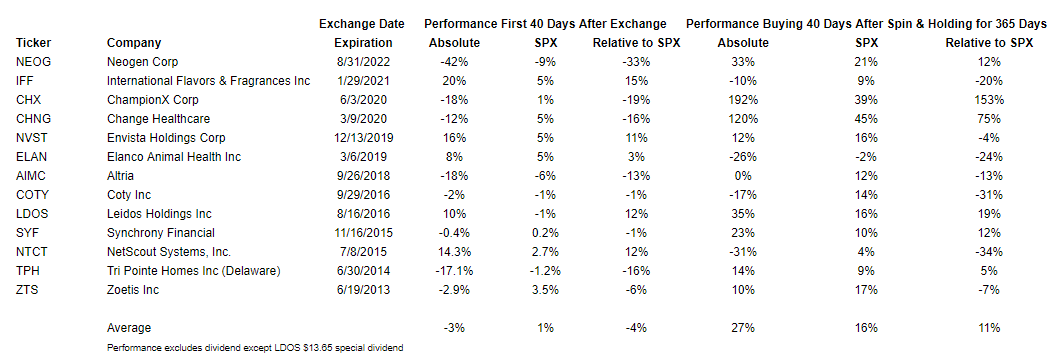
As shown above, the typical stock that is split off from its parent declines by 3%, underperforming the S&P 500 by 4% over its first 40 days of trading.
So far, ATMU has bucked the trend, but we believe the stock is due to retrace some of its recent gains as investors that exchanged their CMI for ATMU shares take profits.
From a fundamental perspective, Atmus Filtration is a fine business. If it does sell off sharply, I may recommend buying the stock. But at the current valuation with the potential for technical selling pressure from legacy CMI shareholders, I think we could see downward pressure.
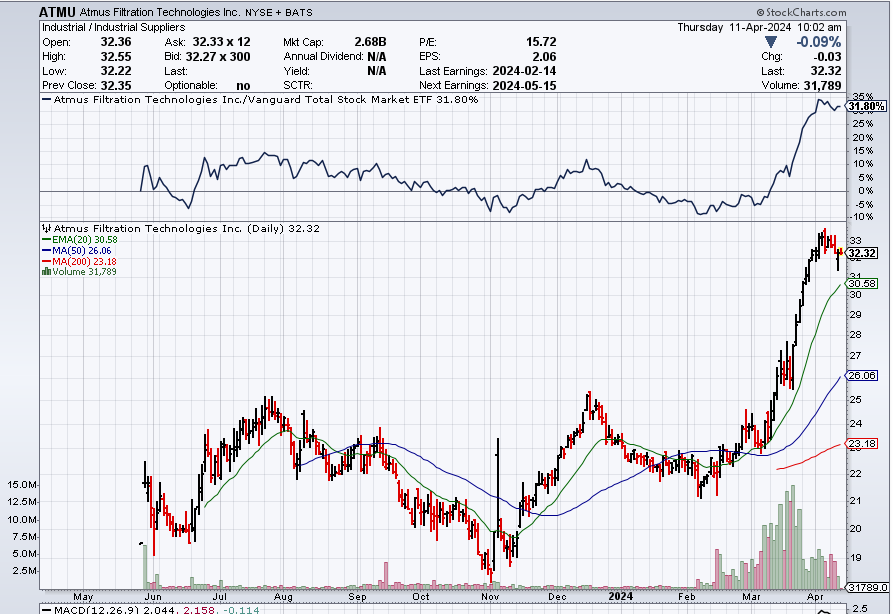
As we can see from their chart, the rally in ATMU appears close to peaking, and we are counting on a reversion pattern due to the number of times that we see it in similar spinoff situations.
RISKS
The maximum amount we can earn from this trade is $400 per contract , while our maximum loss is capped at the price (debit amount) that we pay to establish the position.
Our maximum LOSS is the cost to establish the position, so between $50 and $80 per contract.
Thus, our maximum PROFIT is $350 – $320 per contract, or roughly 4X our capital at risk.
Our best case scenario is that the price of ATMU declines below $27, or around -16% below where it is trading today between now and May 10, 2010. However, if ATMU increases or even just stays at its current levels between now and May, we will lose the entire amount that we have spent to establish the position.
Risk to the Downside: The only risk we face if ATMU declines in price is the opportunity cost from having a spread trade, instead of a naked put. Our maximum return is capped at the difference between $400 and initial cost to establish the position, no matter how low ATMU might decline between now and May 10th.
Risk to the Upside: Even if the ATMU declines, it’s possible that it doesn’t go low enough or long enough for us to profit from the trade. However, we may still get the chance to close the position for an amount that’s lower than our initial cost to establish the position.
Leave A Comment