

MARKET COMMENTARY
PORTFOLIO COMMENTARY
Rather than my usual recap of the events of the past week, I want to use the time that you are dedicating to reading this week’s piece towards answering a question that I hope will be far more meaningful in your options trading journey: in the midst of extreme market volatility, how does one effectively manage the instinct to worry when seeing red figures in one’s portfolio, that nagging impulse to sell everything and quit the market, “until the bottom is in”?
I know that we have a variety of experience levels among subscribers in terms of investing in options, so I am writing this primarily for those who are newer to options. This seems appropriate in that, while none of us are immune to worrying, I know that folks experiencing the impact of option pricing volatility for the first time are more likely to feel heightened anxiety and concern about the potential impact of their SSI: Ultra option positions on their portfolios.
To frame my question slightly differently, what practical steps can one take to decrease the negative emotions – regret, second guessing, anxiety, anger, etc. – that arise in the wake of seemingly large losses in one’s portfolio, particularly with respect to trading options?
While not the only answer, one particularly helpful method that I’ve found, having endured and survived many similar periods in the past, is to look past the paper profit-loss numbers that my brokerage displays online and conducting my own fundamental evaluation of the actual profit-loss figures for each position. I find that doing this review/evaluation regularly is a constructive use of the energy that I would have otherwise wasted worrying if I blindly took for granted the numbers that my brokerage reports.
Far more often than not, I find that the actual positions are in a much better shape than I am expecting prior to performing the evaluation.
That’s because the way that option positions are priced by some (most?) brokerages is flawed, and can lead to distorted impressions of the actual value of the underlying positions. It is not that they are trying to deliberately mislead customers; instead, distortions arise from certain pricing conventions unique to options that excessively magnify/minimize the apparent dollar and percentage losses/gains that your brokerage displays for your positions.
Especially for newer options traders, it is good to be aware of the prevalence of these pricing distortions.
The first of these stems from a distinctly bearish bias in option position price quotes. Most stock market investors are used to getting their price quotes from the last price traded. In contrast, when it comes to options:
- If your experience is similar to mine, your brokerage quotes option prices using the LESS FAVORABLE end relative to whether you are long or short. For example, when I am long a Call or Put, my position will be priced at the Bid price (what a buyer has offered), and if I am short either the Call or Put, I will see it priced at the Ask (what a seller is asking). Both of these conventions can be quite misleading, especially when compared to the mid-point of the Bid-Ask spread, for example, where most trades would actually get priced.
- Bid-Ask spreads for even the most liquid options are already significantly further apart than stock price quotes, and the pricing distortion gets even more pronounced for less liquid options, which have even wider pricing spreads.
If you have ever checked your account at the market open, and noticed all your option positions gaping down in value, even when the price of the underlying is rising, you have certainly seen the effect of this convention in action.
Secondly, volatility, time premium, and the inherent leverage imbedded in options magnify percentage losses; a $1 decline in a $50 stock is a -2% change, but the same -$1 decrease in a $5 option is a -20% decline. Just keep in mind that even though we experience the same effect in the opposite direction, when stock prices move up, the impact is more muted in the upwards direction, thanks to the Bid/Ask pricing convention.
In any case, I went through the evaluation exercise with each of our positions, and the good news is that, in every instance, our investment theses remains intact, and our trading strategies contain ample flexibility to adjust even in the event that we experience further declines in the underlying stock prices.
As long as you are not overleveraged, either through excessive use of margin or overexposure to any single position, we have ample time and flexibility to see all our positions bounce back and perform as we originally planned.
So, let’s review where we currently sit with each position from a fundamental standpoint, keeping in mind these prices are as of the market close on Tuesday.
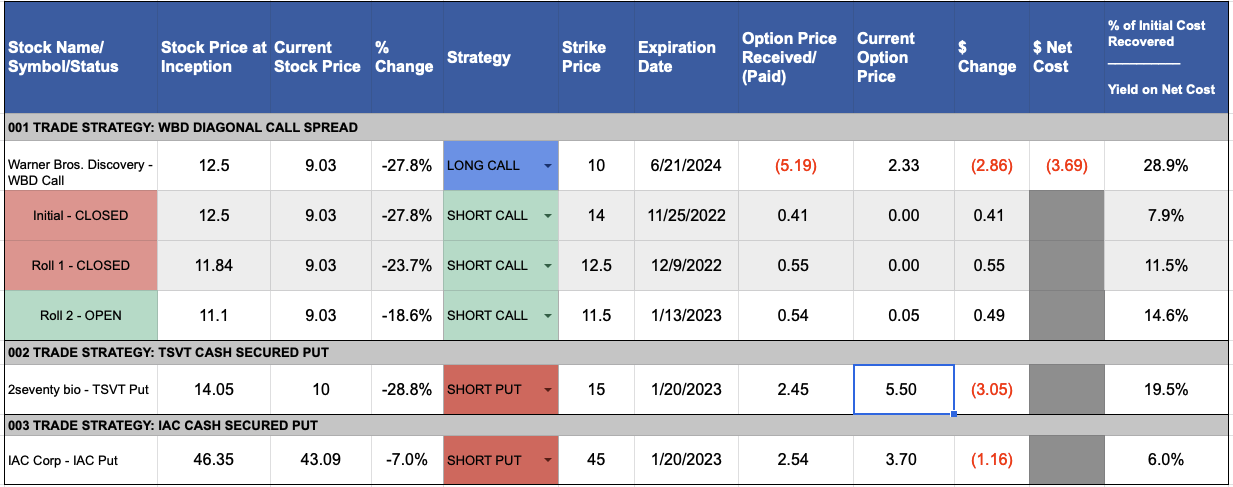
InterActiveCorp (IAC) Short Put – IAC has dropped to $43, which is below the $45 strike price of our January 20 short puts. Your brokerage is most likely showing your IAC 45 Put position as a paper loss of around -$120 per contract based on the current price of the put. Of course, this is extremely misleading…
Recall that (a) we want to eventually acquire the stock anyway, and (b) if the stock was “put” to us today, we would actually be sitting on a profit of $55 to $70 per contract, depending where you fall in the range of $2.55 to $2.7 that subscribers have reported getting in premium for the put. In effect, your NET cost would actually be somewhere between $42.3 to $42.45, and you could turn around and sell the stock for an immediate profit if you were to receive the shares today.
This is a textbook example of how only looking at just the paper profit-loss that your brokerage shows you can lead you to the wrong conclusion about how your option trade is actually performing!
Naturally, there is no guarantee that IAC’s stock price won’t decline further, but let’s look at another position in the portfolio to see some of the potential moves we could employ if that were to happen.
2seventy bio (TSVT) Short Put – TSVT has declined to $10, well below the $15 strike of our short put. We sold the put for around $2.45, which puts our NET cost right around $12.55. Based on the current price of the put, we are looking at a paper loss of around -$300 per contract, if we were to try to close out the position at this moment. But, given we also want to eventually own this stock, we have at least three other options, if we choose to wait till we get closer to the expiration date:
- we can buy to close the put closer to expiration, when the time premium will have shrunk;
- we can let the stock get “put” to us, in which case we will pay the net cost of $12.55 per share; or
- we can roll the put, earning even more premium and thus further lowering our eventual cost basis.
(Side note: as of a month ago, TSVT had approximately $8.50 of net cash on their balance sheet, so the stock is trading intriguingly close to that figure.)
Of course, the optimal route will depend heavily on TSVT’s price as we get closer to expiration, and we will be watching it closely and communicate how we intend to play it when the time is right.
Warner Bros. Discovery (WBD) Diagonal Spread – WBD has declined to around $9, below the strike price of our June 2024 LEAP. While not great, we did in fact consider this as a possible scenario prior to entering the trade and, were WBD’s price to stay at this level for the next year, would not be that bad of an outcome.
As I wrote in the original recommendation:

As it stands, we have already recouped ~$150 of our original investment and, as I write this, we could easily roll the short call that expires on January 13th for an additional credit of $55 to $60 per contract. Look for this trade to happen sooner rather than later, as our short call rapidly approaches $0.
All in all, despite the stock price falling below our strike, we remain in excellent shape to a) continue harvesting hefty premiums for an extended period of time, and b) be well-positioned to further profit from an eventual rebound with our long WBD call position.
CONCLUSION
I hope that you have found this review helpful, and that the process I’ve outlined comes in useful if you ever find yourself frustrated or annoyed looking at the red figures on the online position report from your brokerage. It certainly worked wonders for me as I was reviewing our SSI: Ultra positions to write this weekly update!
CURRENT TRADE POSITIONS
Wishing everyone joy and peace for this holiday season!
Sincerely,
Leave A Comment