

MARKET DASHBOARD
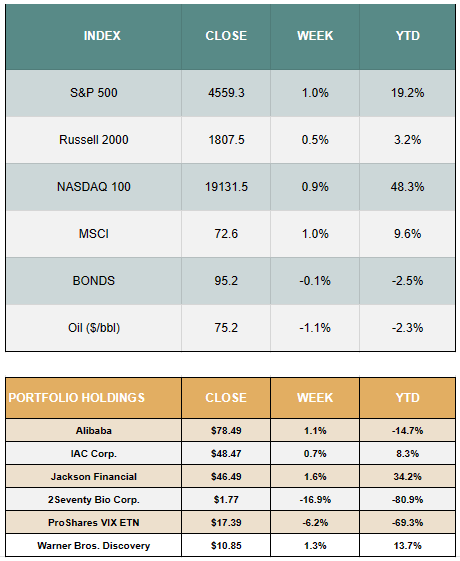
MARKET COMMENTARY
In a holiday shortened week, the major indices all posted gains of between 0.5% and 1%. The S&P 500 notched its 4th straight week of positive returns, and is now +11% higher than its pre-Halloween rally level.
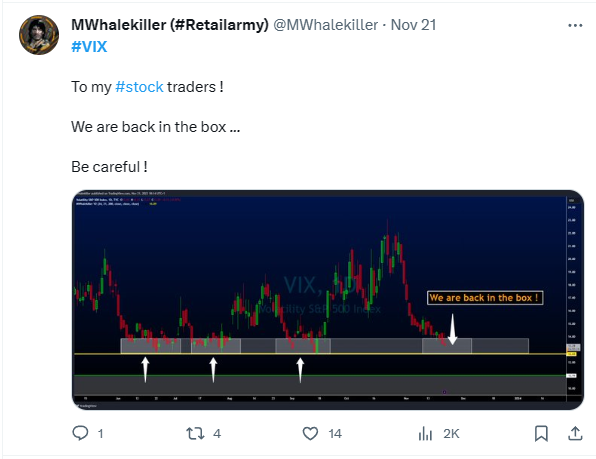
But are investors getting too complacent about the prospects for the current rally to continue through the rest of the year? Conspicuously absent has been any significant volatility in the market, and this phenomenon is not unique to just this most recent rally. The VIX is down around 40% for the year-to-date, close to a 3-year low, and it’s worth bearing in mind that volatility has usually rebounded with a vengeance when the VIX has hit these levels in the past.
In fact, the three most significant economic data releases this past week were not particularly bullish for stocks’ future prospects.
The first, the Consumer Sentiment Index, finished with a reading below 75 for the 28th consecutive month, which matched its record during the GFC over a decade ago.
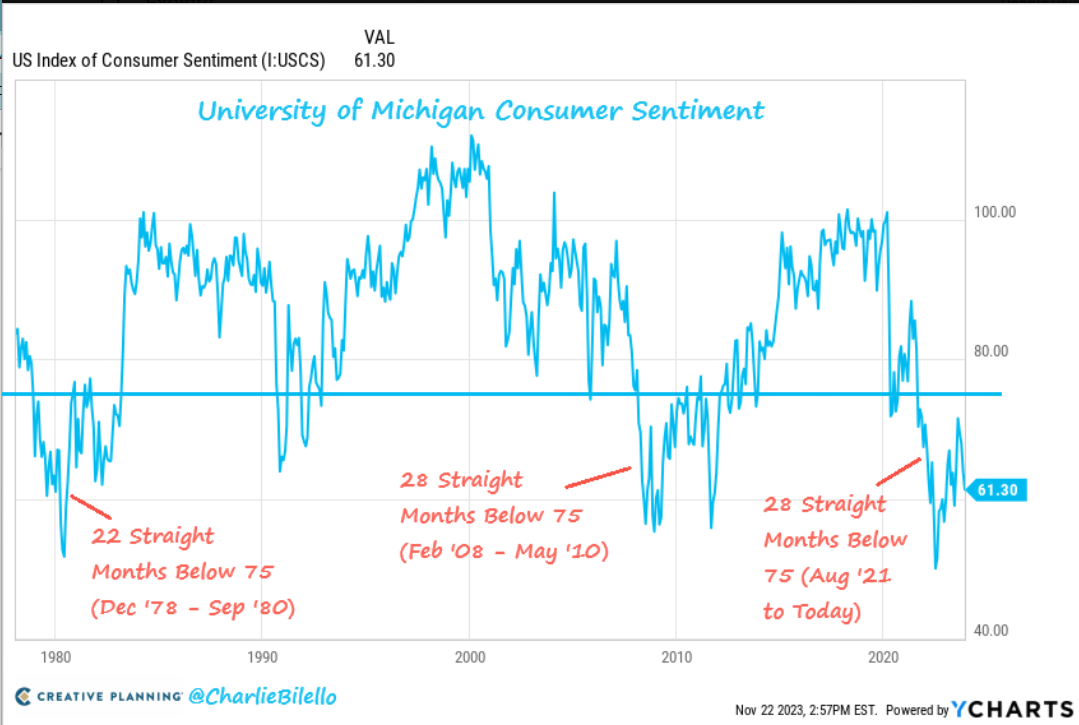
Source: CharlieBilello
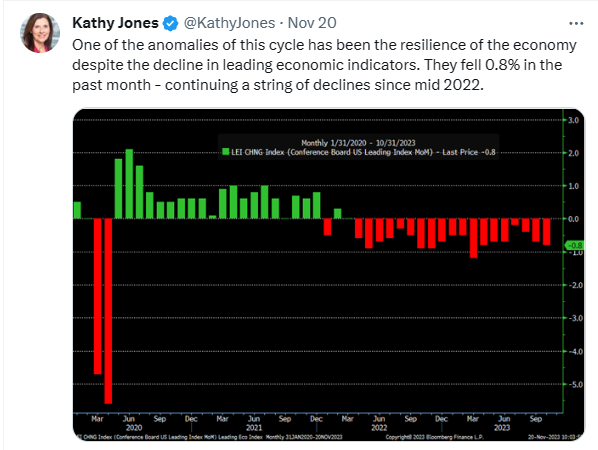
Meanwhile, the US Leading Economic Indicators (LEI) index recorded its 19th straight month of declines and the Conference Board’s accompanying statement noted, “The Conference Board expects elevated inflation, high interest rates, and contracting consumer spending – due to depleting pandemic saving and mandatory student loan repayments – to tip the US economy into a very short recession. We forecast that real GDP will expand by just 0.8 percent in 2024.”
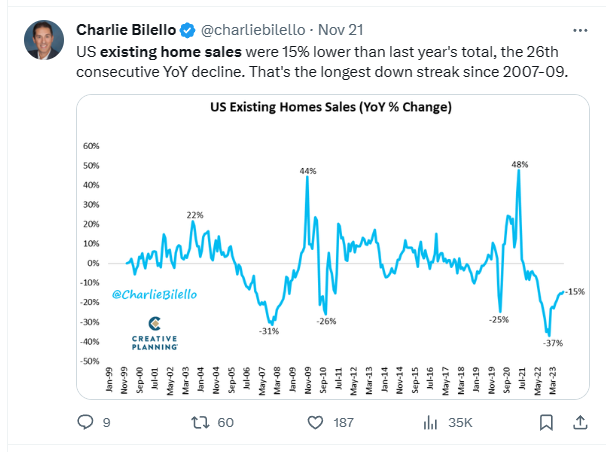
And finally, existing home sales were down ~15% compared to last year, marking 26 straight months of decline and highlighting one of the most glaring market dislocations brought about by the Fed’s rate hike cycle.
Source: CharlieBilello
This coming week, we will be seeing data on Consumer Confidence, Personal income and consumer spending, and Weekly unemployment claims. Remains to be seen if continued weakness in the data will continue to only mean one thing for markets: relief that there’s little chance of an imminent rate hike.
STAT OF THE WEEK
News you can use…
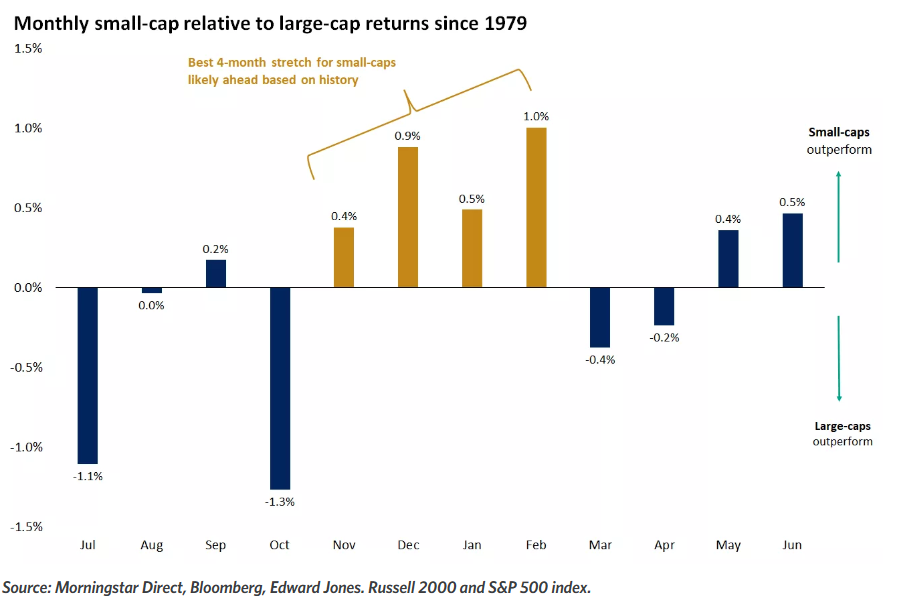
Historically, November through February are the best months for small-cap outperformance relative to large-cap returns.
Source: Edward Jones
BONUS STAT OF THE WEEK
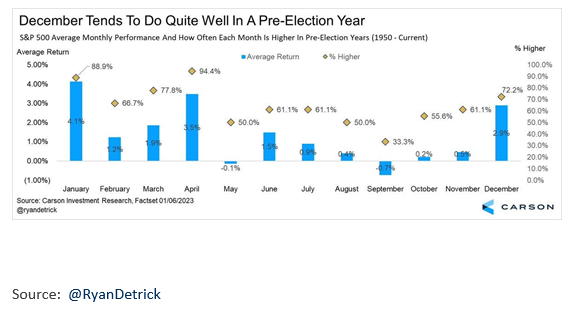
How about a little more data on the market’s historical returns in December…
BONUS STAT OF THE WEEK 2
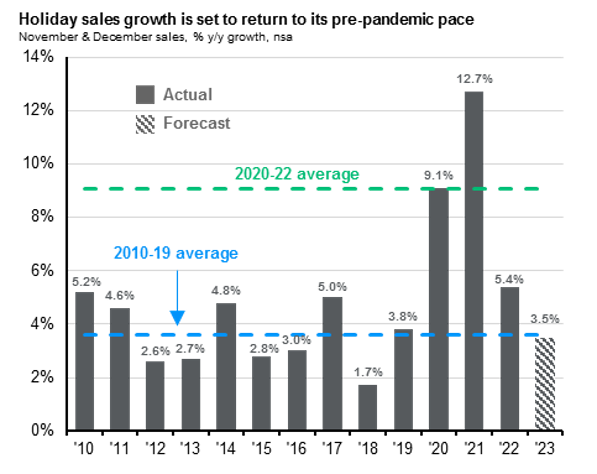
Holiday sales are on trend for the lowest growth rate of the past 5 years – a good sign if we’re worried about inflation flaring up.
Source: JPMorgan
And for anyone that’s read this far…
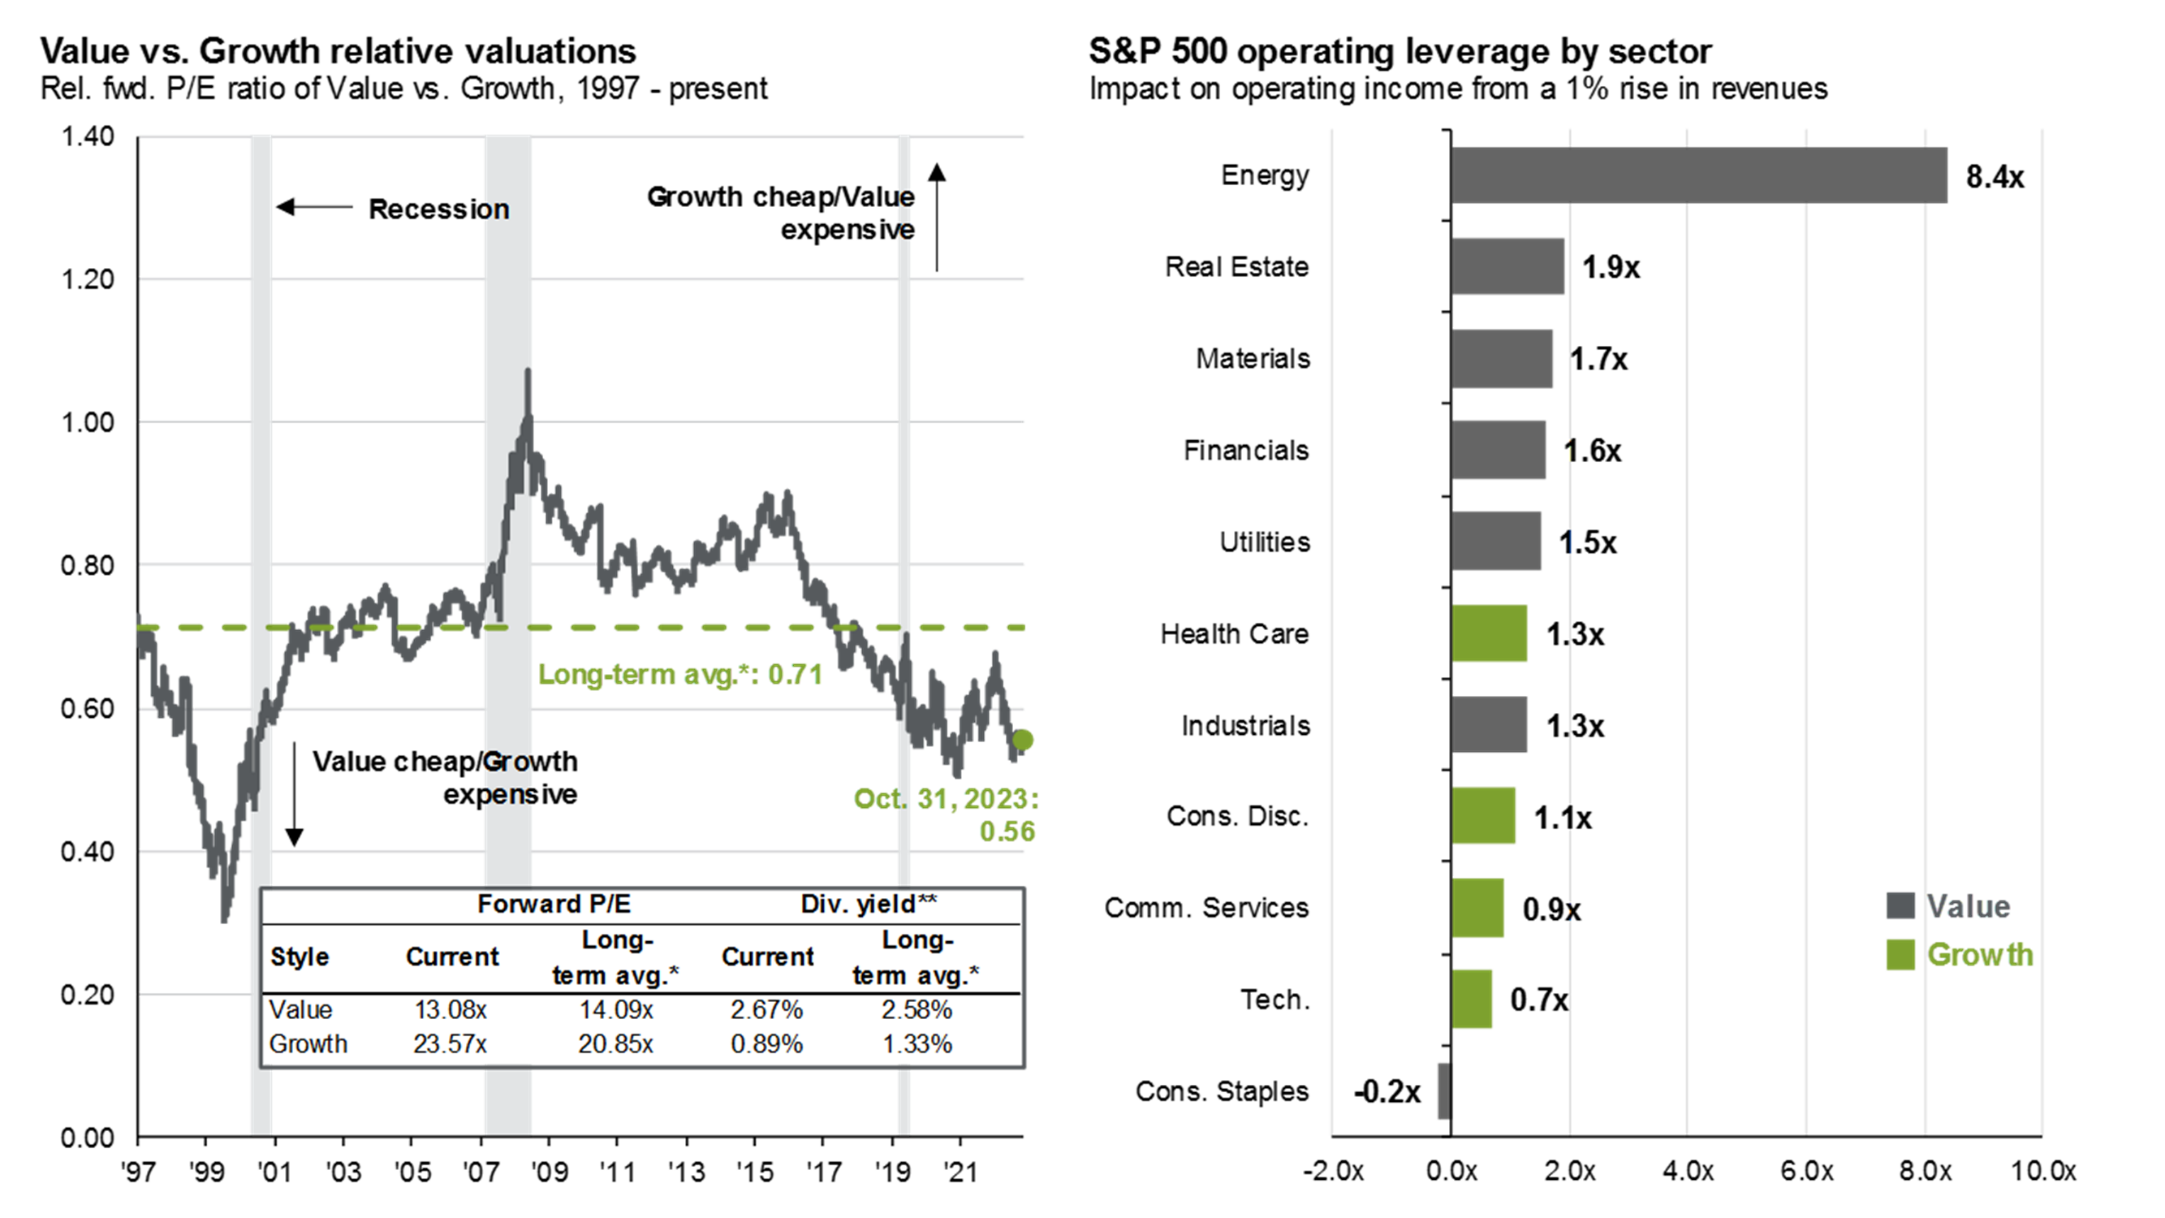
Two excellent charts, courtesy of JP Morgan, showing the tremendous bargains currently available in value stocks, but particularly in the Energy section and, to a lesser extent, in Real Estate and Materials.
Source: JP Morgan
PORTFOLIO COMMENTARY
No new company news this week.
No new company news this week.
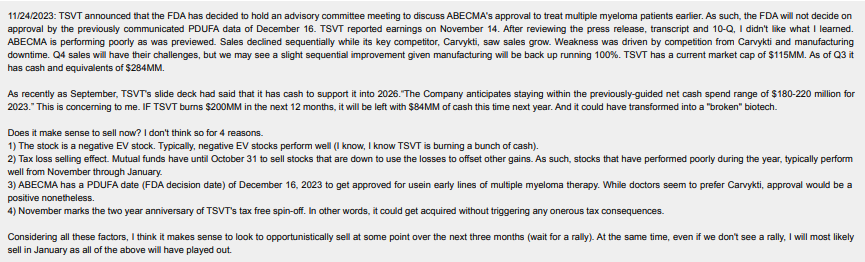
Warner Bros. Discovery (WBD) Diagonal Spread
No new company news this week.
Alibaba (BABA) Bull Call Spread
No new company news this week.
No new company news this week.
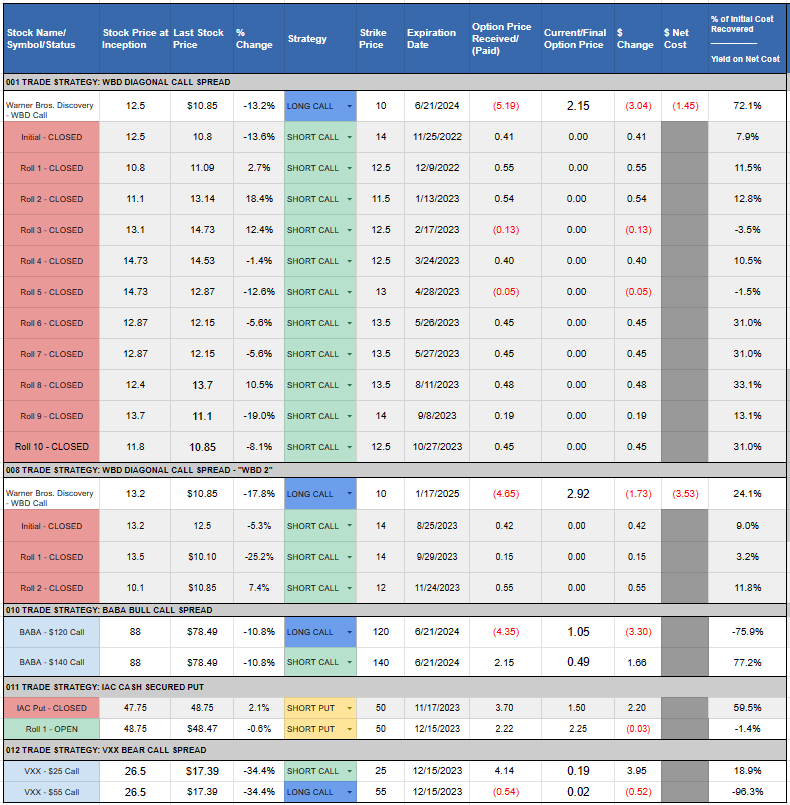
CURRENT TRADE POSITIONS

As always, hope that everyone has a great week!

Disclaimer
The information and opinions contained in this blog and newsletter are not investment advice and should not be taken as such, nor as an endorsement as to the propriety for any individual reader. Trading options involves the risk of substantial loss of capital, up to and exceeding value of your entire portfolio, in certain cases. Readers are solely responsible for making their own investment and trading decisions and must assume the entire cost and risk of any trades they undertake, whether or not based on the information presented in this blog and newsletter. Principals of the Stock Spin-off Investing and SSI Ultra Options Advisory newsletters are not registered as securities broker-dealers or investment advisors with any securities regulatory authority, and are not acting as financial advisers or in a fiduciary capacity. All material presented in this blog and newsletter is for general informational purposes only.
Leave A Comment