
Learn This BEFORE You Start Trading Options
When it comes to options trading, there’s literally an ocean of disparities in what different traders bring in terms of their technical, theoretical and practical knowledge.
Because there are scant barriers to entry, you have a market where hedge funds using algorithmic trading software programmed by Math and Physics Ph.D’s are potentially going head to head against retail investors who are lucky if they are even familiar with the concept of vega. There’s absolutely nothing wrong with it if you fall more into the latter camp (and you may well have a stellar record of profits to show for your trading efforts!), but there are certain essential things that you will definitely find quite useful to know if you plan to continue, or just want to start, trading options.
So, I want to begin with discussing an extremely valuable and highly fundamental concept, but one that I’m not certain will be familiar to everyone that hasn’t studied options in a formal, mathematical way, or who hasn’t traded them professionally. Yes, there’s a little bit of math, but hang with me and you will find it all works out in a very logical, intuitive way.
Let’s start with a very simple, three question quiz that will quickly tell you where you fall on the technical scale, and how useful this will be for you:
Even if you don’t know the name of the strategy that produces them, can you work out the combination of options that produce the following profit/loss patterns just by looking at these pictures?1
1. Let’s start with something basic:
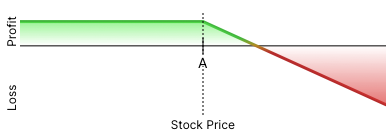
Image source: Optionstrat.com
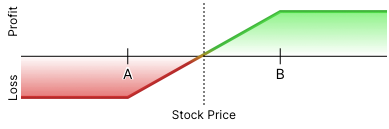
2. Here’s one that’s a little more challenging:
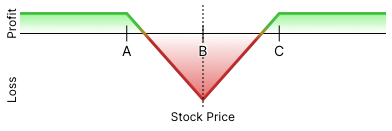
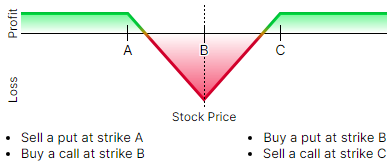
3. Finally, here’s a fairly advanced one*:
How did you do? If you got all three, particularly the last one, then congrats! And, you probably don’t need to keep reading, but thanks for stopping by!
If you got one or both of the first two, you are probably already aware of the point of my article, but you are still welcome to keep reading. Hopefully, you will still learn something useful from the pointers.
If you couldn’t figure out any, let this be your first two takeaways from this piece:
While it will still take practice and repetition to master, by the time that you finish reading this, you will have a basic understanding of what need to know to quickly identify and reverse engineer any legitimate option combination strategy, like the ones you saw above.
And,
If you want to be able to figure out the optimal options trading strategy, customized to your outlook for the future performance of the underlying stock, then you will find it incredibly helpful if you can visualize strategies in terms of these profit/loss patterns. This is much less important if are a single strategy trader, like only selling covered calls, but it is still important to understand the fundamentals behind it.
For example, when I think, “Based on fundamentals/technical analysis/latest analyst forecasts/my gut/etc. I expect this stock to be pretty range-bound, what option strategy can I use to profit from that, which still controlling my downside risk?”, the mental picture that forms in my mind might look something like this:
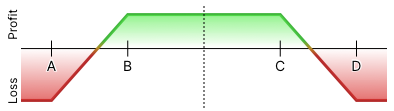
This is what is known as an Iron Condor, which is itself a combination of a Bull Put Spread and a Bear Call Spread. Don’t worry about the names; the more important lesson is to be able to visualize any strategy in terms of a) how much and b) when it is profitable and unprofitable.
This brings us to the next key point, and one that everyone who has read to this point will be very happy to hear:
There are only four (4) basic option patterns that you need to know, and these form the building blocks of every single possible structure out there.
The only four basic option patterns that you absolutely need to know are:
- Long call
- Short call
- Long put
- Short put
That’s it.
Ready for more good news?
To unlock the power of visualization and master combination creation, there is a single, straight-forward equation** that only requires high school algebra to fully understand.
Let me derive it via a simple visual exercise.
First, can we all agree that this is the profit/loss profile from a long position in a stock (let us call it’s ticker symbol BOOG), purchased at price A?

Now let us look at the profit/loss profile at expiration for a long call on BOOG at strike price A, which would look like this:
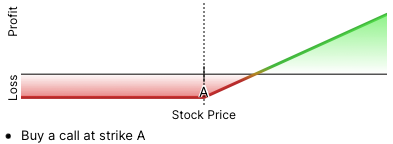
This should be easily understandable – if the stock price is at or below strike price A on the option expiration date, we lose the value of the call premium (which we will call C), and our breakeven is where the stock price is equal to A + C (or, the strike price plus the value of the call premium.)
Let us also look at the profit/loss profile of a short put (where we sell the put) on BOOG at strike price A, which looks like this:
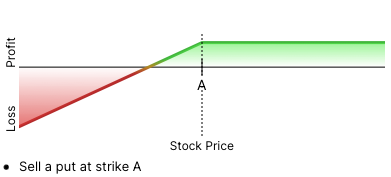
If we let -P stand for the put premium we received (we use the “-“ to show that we are short the put, which means we get paid the premium, rather than paying it out), we see that we get to keep 100% of the premium if BOOG finishes at or above strike A at expiration, and that our profit declines in proportion to how much below the strike price BOOG’s stock price, with our breakeven where the stock price is equal to A – P.
So, what is the profit/loss profile if I were to buy a call and sell a put on BOOG, both at strike price A and with exactly the same expiration date?
Well you can see that by combining the 2 previous pictures will result in a profit/loss profile that looks like this:
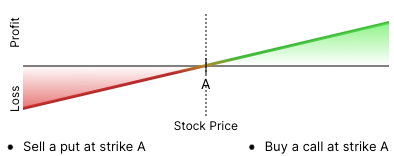
Remind you of anything we’ve see before?!?
Of course, this is EXACTLY the same profit/loss profile as just a long position in BOOG stock, which looks like this:
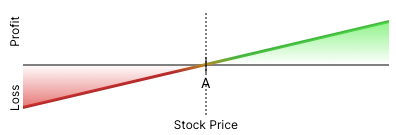
If you simultaneously buy a BOOG Call at strike A and sell a BOOG Put at strike A, you will create the exact same profit/loss profile as buying BOOG stock at price A. This is the basis of what is called the Put-Call Parity Equation.
So, here comes the little bit of math. The (vastly) simplified formula for the Put-Call Parity Equation is the following.
Given:
S = current stock price of underlying
C = call premium
P = put premium
A = strike price of put and call
r = the risk free interest rate
t = time to expiration
CA + A/(1+r)t = S + PA
Let me further simplify this equation by re-writing the term A/(1+r)t as simply “the present (discounted) value of the strike price A” or PV(A). This reduces the Put-Call Parity Equation to its most simplified form:
CA + PV(A) = S + PA
If the equation is too abstract, or you are a more visual learner, this can be interpreted as follows: The value of the call premium at strike price A plus the present value of the strike price A in cash must equal the current value of the stock plus the put premium at strike price A.
This is the equation that I was referring to in my title. And trust me, the more you think about and work with the Put-Call Parity Equation, the more it will impact your thinking and approach to options trading.
For example, let’s take a look at this picture for the third time…

Using the Put-Call Parity Equation, we can use basic algebra to figure out how to synthetically (use options) replicate a long position in BOOG stock. If I rearrange the terms of the equation to solve for S (the stock price), I get
S = CA – PA + PV(A)
This immediately tells us three very important things:
First, it confirms that I should be able to replicate owning a stock by simultaneously buying a call and selling a put at strike A, plus holding the amount of cash equal to the present value of strike A. But, let’s go a bit further and assume that a) the strike price is $15, b) interest rates are very low (and/or time to expiration is very short) so that the present value of A, PV(A), is also $15, and c) that BOOG is currently trading at $15.
Now we get:
CA – PA = S – PV(A) = $15 – $15 = $0
CA – PA = $0
This should make any options trader reading this very, very excited. Remember that we earlier established that,
If you simultaneously buy a BOOG Call at strike A and sell a BOOG Put at strike A, you will create the exact same profit/loss profile as buying BOOG stock at price A.
To which we can now also add,
If BOOG stock is also trading at a price equal to A, then we can synthetically replicate owing a long position in the stock at the cost of $0, or no money out of our pockets, because the premiums received from selling the put should exactly offset the premiums that we pay for the call.
This is the second important thing that this arrangement of the Put-Call Parity Equation is telling us.
The third important thing this tells us, is that every single financial instrument in that equation – the stock, the call and the put – can be synthetically replicated from both the long and short sides by a combination of the other three instruments and cash. And all it takes is a bit of basic algebra to figure out how.
If you didn’t know this before, well you’ve just learned one of the most valuable fundamental lessons about option trading there is to know.
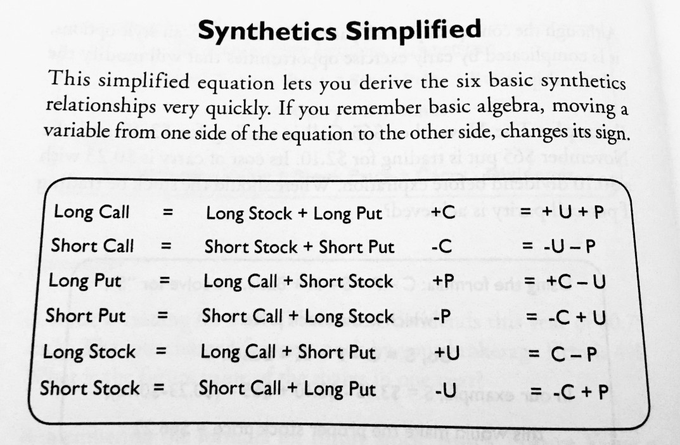
What we have covered so far is just scratching the surface of how useful the Put-Call Parity Equation can be. Literally whole books have been written about the creation and use of synthetics so it’s too big a topic to cover here. However, for those interested, I have included a short “cheat sheet” to creating different options and options arrangement synthetically, which you can find here. And there are many other books, blogs, YouTube videos, etc. that you can consult if this topic is of additional interest.
I’m sure more than a few of you reading this are quite skeptical, and thinking something along the lines of, “That’s just a theory, and I’m sure there are many examples of stocks with options where this equation does not hold.”
To that I would say, there aren’t too many of those opportunities, so if you find any, you should jump on that mispricing and profit from it! Just like mispriced stocks, mispriced options are a great place to find trading profits.
And the skeptics will say, what is the mechanism that insures that this equation will hold, and not be thrown off by just pure supply and demand?
Well, remember all those Ph.D programmers working for hedge funds, using supercomputers to trade? One of the most basic programs they run just scans option price tables looking for any mispricing in the form of violations of the Put-Call Parity Equation and then immediately determines whether it’s the underlying or the synthetic which is over/underpriced. Using the basic principles of arbitrage, they will systematically buy the underpriced side and sell the overpriced one. Good old arbitrage is the mechanism that keeps the whole system in check.
CONCLUSION
I hope that you have both enjoyed and learned something through this brief exploration of the Put-Call Parity Equation! It is one of those fundamental building blocks of options theory and trading. If you were not fully aware of it or its implications prior to this article then, at the very least, you have a much clearer understanding of the underlying rules that govern options pricing, and how to identify and exploit potential mispricing in the options market.
And remember, the more you can VISUALIZE profit/loss patterns, the more effective you will be at identifying the best option trading strategy that matches your outlook for the future performance of the underlying stock’s price.
Additional Resources
https://www.investopedia.com/terms/p/putcallparity.asp
https://www.theoptionsguide.com/understanding-put-call-parity.aspx
https://smartasset.com/financial-advisor/put-call-parity
Footnotes
A) Short Call
B) Bull Call Spread OR Bull Put Spread; they have the same payoff profile. It’s easy when there’s two ways to get it right!
C ) Long (or Inverted) Iron Butterfly
**Full confession for the super technical purists out there: I did mislead a bit by saying it was a simple formula. The full version does include a bit more advanced math to explain (exponentials, specifically), but the fundamental, simplified version is directionally accurate. I have also glossed over the differences between European and American options, which I fully admit. But if I hadn’t, this article would almost certainly have been too dry and technical to get through.


Leave A Comment